MTTR, mean time to repair, is the first number most maintenance teams are asked for. It answers a simple question: once something breaks, how long until it works again? It is also easy to calculate badly, and an average can make a team look fine while a handful of machines sit broken for weeks.
This guide covers how to calculate MTTR, why the median is often the better number, and the other maintenance KPIs worth tracking beside it.
What is MTTR?
MTTR (mean time to repair) is the average time between a fault being reported and the equipment being back in service. It is a measure of how responsive your maintenance process is, from the moment you know about a problem to the moment it is fixed.
You will sometimes see MTTR stand for mean time to recovery or restore, mostly in IT. In facilities and equipment maintenance, it almost always means repair.
How to calculate MTTR
The formula is:
MTTR = total repair time ÷ number of repairs
For each resolved request, take the time it was resolved minus the time it was reported. Add those up and divide by the number of requests.
Example. Five requests were resolved last month with these repair times:
| Request | Time to repair |
|---|
| Treadmill belt | 4 hours |
| Leaking tap | 6 hours |
| Broken locker | 8 hours |
| Hand dryer | 10 hours |
| Rowing machine (waiting on a part) | 312 hours |
Total repair time is 340 hours across 5 repairs, so MTTR is 68 hours, almost three days.
Why the median tells you more
Look at the example again. Four of the five repairs took less than half a day. One took thirteen days. The average says “about three days”, which describes none of them.
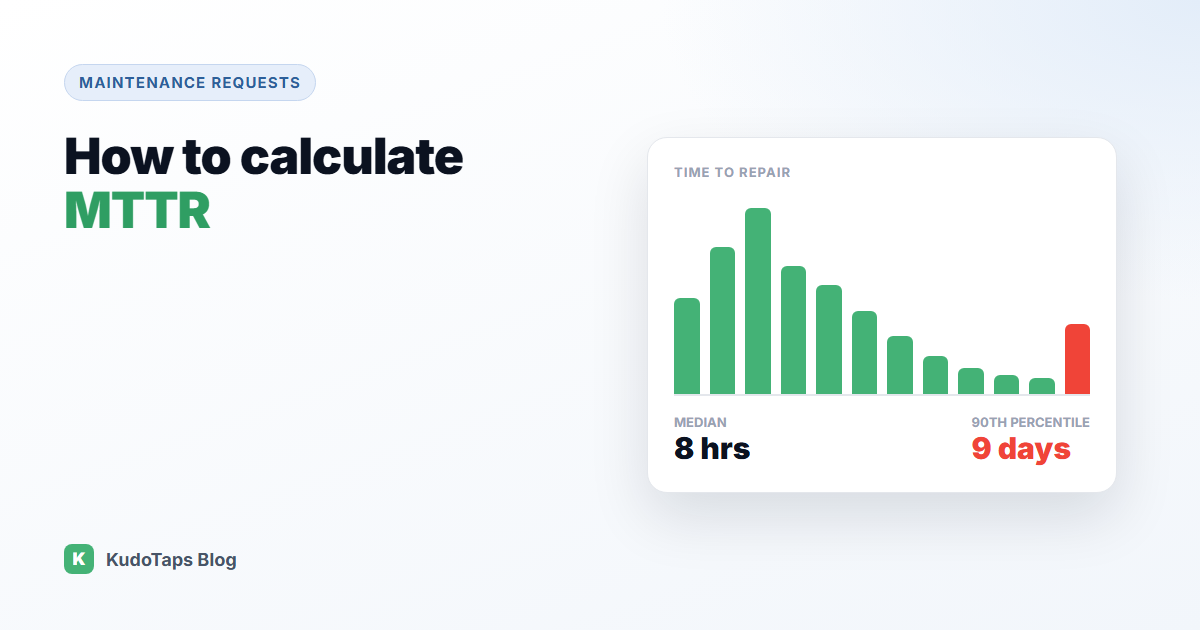
The median is the middle value when you sort the repair times: 4, 6, 8, 10, 312. The median repair time is 8 hours, which is what a typical fault actually experiences. One long repair cannot drag it around.
That is why it helps to report both:
- Median time to repair tells you how the typical request goes.
- The 90th percentile tells you how bad the slow ones get. If it is 9 days, one request in ten takes at least that long, and those are the ones customers remember.
Other maintenance KPIs to track beside MTTR
- Requests per machine. Divide requests by the amount of equipment, so a big site does not look worst just for being big.
- Repeat failures. A request raised within 30 days of the same machine being marked fixed. Repeats mean the fix did not hold.
- Ageing. How many open requests are older than a day, a week, a month. A growing tail is an early warning.
- Reported vs fixed. Per week. If more come in than go out, the queue is growing.
- MTBF (mean time between failures). Useful for critical equipment once you have enough history.
How to reduce MTTR
- Shorten the time to report. The clock starts when someone notices, not when you hear. A QR label on the machine lets anyone report it on the spot.
- Get the details right first time. Machine, location and a photo save a diagnostic visit.
- Assign immediately. Unassigned requests wait.
- Chase the 90th percentile, not the average. Look at the slowest requests every week and ask what held them up.
- Fix repeats properly. A machine that fails every three weeks is a replace decision, not a repair.
How KudoTaps reports repair times
The reports in KudoTaps Maintenance Requests are built around these numbers: median fix time, the 90th percentile, requests per machine, repeats within 30 days, ageing of open requests, and reported vs fixed per week. Each report is also broken down by location, so you can see which sites are slow. See the fix time tracking use case and repeat equipment failures.
Frequently asked questions
What is a good MTTR?
It depends on the equipment and the industry. Compare against your own history, track the trend, and pay most attention to the slowest repairs.
What is the difference between MTTR and MTBF?
MTTR measures how long repairs take. MTBF (mean time between failures) measures how long equipment runs between breakdowns. One is about your response, the other about reliability.
When does the MTTR clock start?
Usually when the fault is reported. That is why fast, easy reporting improves MTTR by itself.
Should I use the mean or the median for repair time?
Report both if you can. The median shows the typical repair, and a high percentile shows how bad the slow ones get.
See your real fix times, by location
Median fix time, the slowest repairs, repeats and ageing, without building a spreadsheet.